NumPy: What the difference between mgrid and meshgrid
NumPy mgrid and meshgrid are, in fact, doing the same things. They generate N-dimensional coordinate grid for N-dimensional field calculations. In this short article, I will show you, how you can use these functions and what is the difference between them. I will also will give an idea, how to read them from external programs.
I’ve already use meshgrid function in some calculations, see for example:
Electric field potential and intensity (Python visualization of electric field),
Interactive Electric field with Mathplotlib (Interactive Electric Field) and Continuous Electric field lines (Drawing continuous Electric field lines). Also mgrid was described: 3D Electric field with Mayavi and the same with visual explanation: Field Lines with Mayavi.
Despite such extensive usage of these two functions with very similar properties, I do not explain, what they doing and what is the difference between mgrid and meshgrid
In all further examples, I will assume, than NumPy and matplotlib are already loaded
import numpy as np
import matplotlib.pyplot as plt
NumPy mgrid syntax
To generate spatial coordinate grid with mgrid function from NumPy it is necessary to know the start and end points in every axis and also number of steps or step size.
mgrid with stepsize
X, Y = np.mgrid[0:10:2, 0:20:5]This function will create X and Y two dimensional arrays with shape 5, 4 containing:
## X
#[[0 0 0 0]
 [2 2 2 2]
 [4 4 4 4]
 [6 6 6 6]
 [8 8 8 8]]
## Y
[[0 5 10 15]
 [0 5 10 15]
 [0 5 10 15]
 [0 5 10 15]
 [0 5 10 15]]
As you can see, the high range is not included.
mgrid with number of steps
Another way of using mgrid, is to give number of steps as an imaginary value. But in this case, the high border will be included. To make almost the same coordinate grid we should use the following command:
X, Y = np.mgrid[0:8:5j, 0:15:4j]Results will be the same in shape but slightly different in the type of arrays. In this case it will be float.
## Xj
[[0. 0. 0. 0.]
 [2. 2. 2. 2.]
 [4. 4. 4. 4.]
 [6. 6. 6. 6.]
 [8. 8. 8. 8.]]
## Yj
[[0. 5. 10. 15.]
 [0. 5. 10. 15.]
 [0. 5. 10. 15.]
 [0. 5. 10. 15.]
 [0. 5. 10. 15.]]
It is important to remember about these tiny differences.
NumPy meshgrid syntax
Meshgrid is more similar to mgris syntax with imaginary number of steps, but you should provide list of grids. This can be useful for non-linear or any kind of irregular grid points. For linear grid, it is very convenient to use numpy linspace to generate grid points towards each axis. So let’s generate the same 2-dimensional grid:
xlist = np.linspace(0, 8, 5)
ylist = np.linspace(0, 15, 4)
Xm, Ym = np.meshgrid(xlist, ylist)
And the result will be:
##Xm
[[0. 2. 4. 6. 8.]
 [0. 2. 4. 6. 8.]
 [0. 2. 4. 6. 8.]
 [0. 2. 4. 6. 8.]]
## Ym
[[ 0.  0.  0.  0.  0.]
 [ 5.  5.  5.  5.  5.]
 [10. 10. 10. 10. 10.]
 [15. 15. 15. 15. 15.]]
As you can see, the data generally the same, but the orientation looks different
How to use mgrid and meshgrid coordinate grid-points
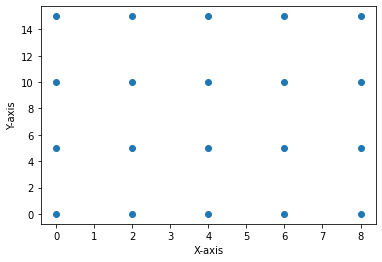
Both mgrid and meshgrid generating arrays with dots in every grid of our spatial domain. By joining X and Y arrays you can make a pair of coordinates for every grid-point:
X, Y = np.mgrid[0:8:5j, 0:15:4j]
XY = np.vstack([ X.reshape(-1), Y.reshape(-1) ])
print(XY)
#[[ 0.  0.  0.  0.  2.  2.  2.  2.  4.  4.  4.  4.  6.  6.  6.  6.  8.  8.   8.  8.]
# [ 0.  5. 10. 15.  0.  5. 10. 15.  0.  5. 10. 15.  0.  5. 10. 15.  0.  5.  10. 15.]]
You can plot these points for 2 or 3 dimensional cases:
fig = plt.figure()
ax = fig.add_subplot()
ax.set_xlabel('X-axis')
ax.set_ylabel('Y-axis')
plt.scatter(X, Y)
plt.show()
2-dimensional grid-points generated by MumPy mgrid function.
You can easily check, that meshgrid will produce the same grid-ponts.
How to use grid-points coordinate arrays
Generally speaking, if you have a NumPy array with coordinates, you can apply any function to it and calculate array with values in these grid-points. Or, for more detailed exmples, please go to check our article about Electric field potential and intensity calculations
What is the difference between mgrid and meshgrid
For two dimensional case you can change between mgrid and meshgrid structure by transposing one of them. In higher dimensional case the procedure will be slightly different. So let’s imagine, that X, Y is a mgrid structure and Xm, Ym - meshgrid respectively.
Converting between 2D cases
For two dimensional case matrix transpose will do the job. To compare NumPy structures, which should be identical I do prefer to use array_equal function from NumPy
print(np.array_equal(X, Xm))
#False
print(np.array_equal(X, Xm.T))
#True
print(np.array_equal(X.T, Xm))
#True
Converting in 3D-case
I will generate structures, then check the shape and then do conversion
X, Y, Z = np.mgrid[0:3:1, 0:40:10, 0:500:100]
xlist = np.linspace(0, 3, 3, endpoint=False, dtype=int)
ylist = np.linspace(0, 40, 4, endpoint=False, dtype=int)
zlist = np.linspace(0, 500, 5, endpoint=False, dtype=int)
Xm, Ym, Zm = np.meshgrid(xlist, ylist, zlist)

print(X.shape)
#(3, 4, 5)
print(Xm.shape)
# (4, 3, 5)
As you can see, the difference is only in the order of first two axes (axis-0 and axis-1). To make them identical, it is necessary to swat these two axis with command swapaxes
print(np.array_equal(Xm, X))
#False
print(np.array_equal(Xm.swapaxes(0, 1), X))
#True
print(np.array_equal(Xm, X.swapaxes(0, 1)))
#True
Converting between mgrid and meshgrid in N-dimensional space
Bearing in mind, that in two-dimensional case, the transposition of matrices are equal to swapaxes(0, 1) it is possible to predict, that in any dimensional case, command swapaxes(0, 1) will convert from mgrid and meshgrid and vice versa.
Published: 2022-10-15 19:03:38
Updated: 2022-11-21 22:41:51