Hierarchical clustering in R
Another approach to clustering is to build hierarchy of all possible distances between objects in the dataset. This plot called Cluster Dendrogram. One of the advantages of these hierarchical tries (Dendogram) that it is very easy to analyse them visually without mathematical calculations and understand how different classes are appear in the set.
Calculating hierarchical tree
Using all iris data
We will use all available data for clustering by Hierarchical trees (hclust()).
library(dplyr)

unlabeled_iris <- iris %>% select(-Species)
iris_hierarchy <- hclust(dist(unlabeled_iris), method="centroid")
plot(iris_hierarchy)
As a result we will have the following dendogram:
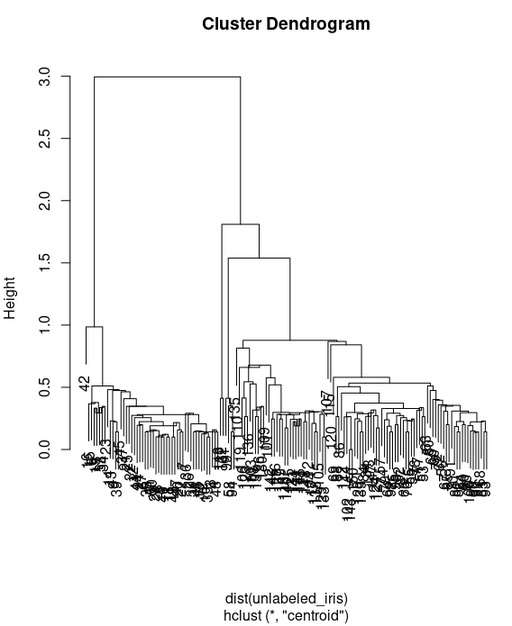
Dendogram calculated with all available data for iris dataset. It is easy to see, how these distances are slitted into two main groups.
Original image: 568 x 695
This hierarchical tree reveals, that we have two separated group, but not three. Lets check it in more details. We will select 3 clusters from this tree and check how it is related with our species. cutree() will split our hierarchical tree into 2 groups and then table() will show relation with or real species
iris_cluster <- cutree(iris_hierarchy, 3)
table(iris_cluster, iris$Species)

#iris_cluster setosa versicolor virginica
#           1     50          0         0
#           2      0         50        48
#           3      0          0         2
setosa was separated clearly. versicolor is clearly separated as well, but almost all virginica was classified as versicolor. Clearly this is very bad clustering
Let’s check it on the plot
plot(unlabeled_iris$Petal.Length, unlabeled_iris$Petal.Width,
     pch=c(22,21,23)[iris_cluster],
     bg=c("red", "green", "blue")[iris_cluster])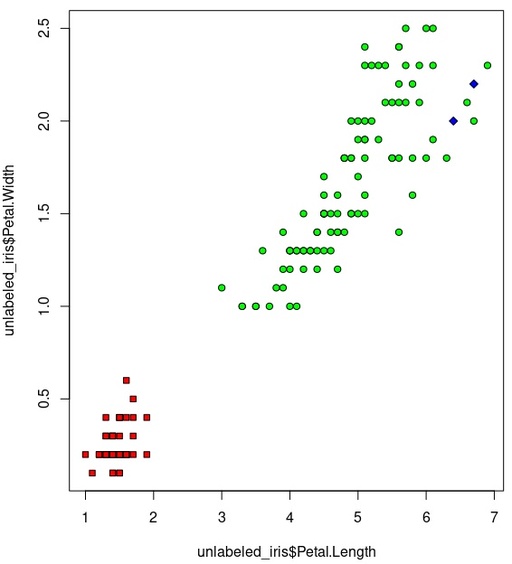
Hierarchy clustering on the basis of all available data.
Original image: 566 x 624
It is possible to see how green dots are cover almost all big area, which is wrong. So really, our clustering is fail on this example.
Using Petal.Length and Petal.Width iris data
Now we will do hierarchical clustering on the basis of only Petal.Length and Petal.Width sets in our iris dataset.
library(dplyr)

unlabeled_iris2 <- iris %>% select(Petal.Length, Petal.Width)
iris_hierarchy2 <- hclust(dist(unlabeled_iris2), method="centroid")
plot(iris_hierarchy2)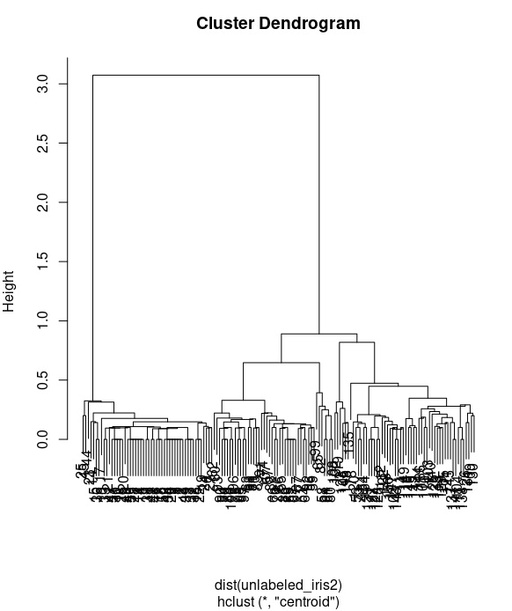
Dendogram calculated for only on the basis of only Petal.Length and Petal.Width set of data.
Original image: 582 x 694
This hierarchy tree is more clearly shows the splitting into 3 groups and this is very promising. Now we will check it with cutree() by comparing our cauterization with original species
iris_cluster2 <- cutree(iris_hierarchy2, 3)
table(iris_cluster2, iris$Species)

#’iris_cluster2 setosa versicolor virginica
#            1     50          0         0
#            2      0         45         1
#            3      0          5        49
As it is possible to see now, the separation between three groups is almost ideal. There are some confusing between versicolor and virginica species, but this is much better than our previous solution. Let’s check it visually by plotting new clustering and original datasets
plot(unlabeled_iris2$Petal.Length, unlabeled_iris2$Petal.Width,
     pch=c(22,21,23)[iris_cluster2],
     bg=c("red", "green", "blue")[iris_cluster2])

plot(iris$Petal.Length, iris$Petal.Width,
     pch=c(22,21,23)[iris$Species],
     bg=c("red", "green", "blue")[iris$Species])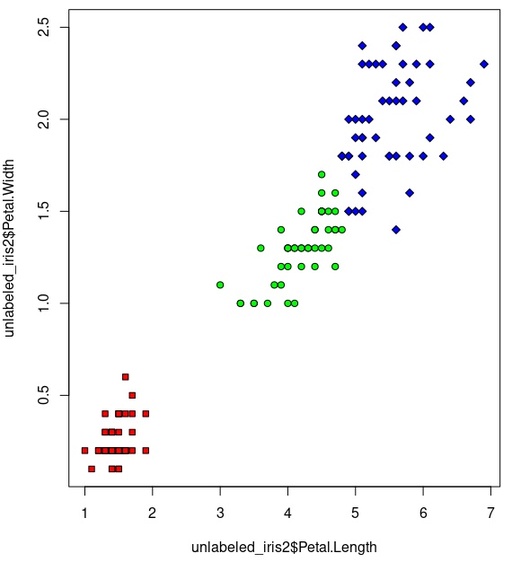
visual splitting for Hierarchy clustering on the basis of Petal.Length and Petal.Width datasets.
Original image: 570 x 626
And for reference we can compare with origina species distribution:
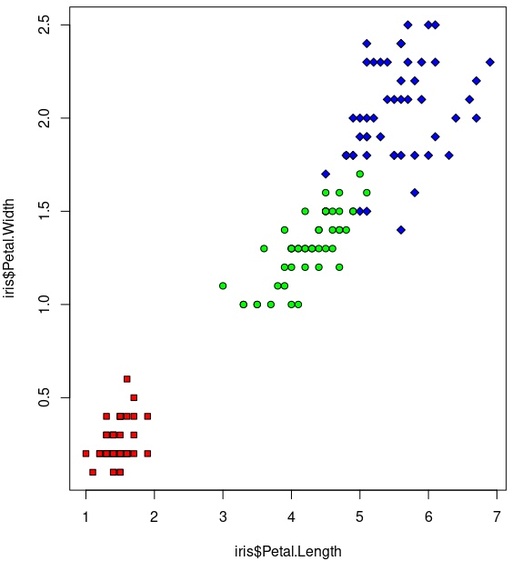
Species in the iris dataset
Original image: 563 x 617
Hierarchy clustering conclusion
This example shows that it is very important to be very accurate with selected data for analysis. Sometimes additional information which give identical results for different groups can give very bad addition to the final clusterization.
Published: 2021-11-18 06:20:20