Generating random distribution for given probability function, 1d case
A very common problem - generate a set of random values in some range in accordance with the probability function, defined over this space.
There are three different approaches to dealing with this problem. Numpy.random.choice, projection to cumulative distribution and rejection Sampling process. In this article, I will consider the first two algorithms and the rejection Sampling process I will explain for the 2D case. This problem was also explained in the video.
numpy.random.choice
If this space is discrete, then it is very easy to use numpy function random.choice. But for continuous distribution, this function is not suitable. In the worst-case scenario, you can use a very fine sampling, compatible or exciting a number of required random selections or add some extra noise to the final selection, but both these methods are not ideal.
Projection to Cumulative distribution
First of all, it is necessary to mention, that this method is only working for 1D cases. For "d and more dimensional space, we need to use different techniques. The main Idea of Projection to Cumulative distribution is to use normalized to 1 cumulative sum of the distribution function and then random distribution in the Y direction from 0 to 1 will produce random distribution over the X axis which will represent the given probability function.
Python implementations
So, let's implement these ideas into Python code!
First of all boring stuff. Loading libraries, initialization of the probability function - we will use the Gaussian function for the start and number of dots places and number of bins for function calculations.
import numpy as np
import matplotlib.pyplot as plt

def F(r):
    return np.exp(-r**2)

# Number of dots to generate
N = 2000

r_values = np.linspace(0, 5, 2000)
Next step - we need to calculate the probability value for every range in our r_values set and then make a cumulative function and then normalize it to 1. It is interesting to note, that the cumulative function is an approach to the constant, therefore for normalizing we can divide it into the biggest number which is the last number in this sequence. Or, otherwise, you can apply max() function to find the maximal value.
probabilities = F(r_values)
cdf = np.cumsum(probabilities)
cdf /= cdf[-1]  # Normalize the CDF
After all these preparations, we need to apply our main idea of converting the random distribution of N dots with the function intewrp from Numpy library.
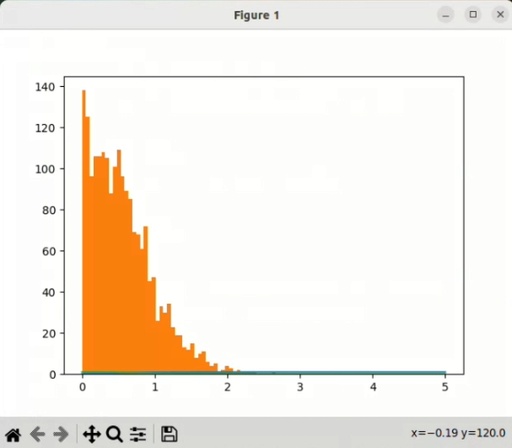
random_values = np.interp(np.random.rand(N), cdf, r_values)Now we can display these randomly placed dots. I think it is more easy to display them by the histogram of their density. And this histogram should be similar to the probability function.
plt.hist(random_values , 50)
plt.show()
The histogram of the distribution of randomly placed dots according to the Gaussian probability function.
Original image: 607 x 531
As you can see from the picture, the distribution of the dots is pretty similar to the Gaussian distribution, given as a reference function.
More detailed information you can see in the following video:
Full Python code
import numpy as np
import matplotlib.pyplot as plt

def F(r):
    return np.exp(-r**2)

# Number of dots to generate
N = 20

r_values = np.linspace(0, 5, 20)
probabilities = F(r_values)
cdf = np.cumsum(probabilities)
cdf /= cdf[-1]  # Normalize the CDF
random_values = np.interp(np.random.rand(N), cdf, r_values)

# Display the randomly placed dots
print("Randomly Placed Dots:", random_values)

# Plot the distribution and the randomly placed dots
plt.plot(r_values, probabilities, label='Probability Distribution')
plt.scatter(random_values, np.zeros_like(random_values), color='red', label='Randomly Placed Dots')

plt.scatter(random_values, np.random.randn(*random_values.shape), color='red', label='Randomly Placed Dots')
plt.xlabel('r')
plt.ylabel('Probability')
plt.legend()
plt.title('Randomly Placed Dots Using Probability Distribution')
plt.show()
Published: 2023-08-11 02:56:07
Updated: 2023-08-11 02:57:28