Streamplot in Matplotlib
Matplotlib.pyplot.streamplot() in Python is used to visualize 2D vector fields in Python. It is useful to visualise any kind of 2 dimensional vector fields and gradients. I already show an example how to visualise electric field lines visualise electric field lines. But in this article I will give more detailed description of this function.
How to use Streamplot
To run Streamplot it is necessary to have coordinates in the domain and values of components of the vector to display, so you need to load libraries first
import numpy as np
import matplotlib.pyplot as plt
Then, it is necessary to create coordinates, X and Y, 2D-numpy arrays, containing x and y coordinates in every cell of your domain
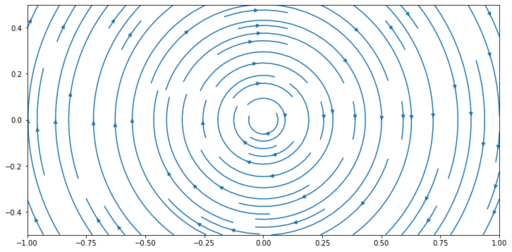
X, Y = np.meshgrid(np.linspace(-1, 1, 20), np.linspace(-0.5, 0.5, 20))At the nest step, it is necessary to calculate vector field in the projection to x and y basis in every point. For example, let’s create circular movement around center
Vx = Y
Vy = -X
And at the next step print it out. Base format to call this function is: plt.streamplot(X, Y, Vx, Vy). Optionally it is better to add density of plotted lines and other parameters of the line.
fig = plt.figure(figsize = (12, 6))
plt.streamplot(X, Y, Vx, Vy, density = 1)
plt.show()
Displaying circular field, Vx=y, Vy=-1 with streamplot from matplotlib.
Original image: 726 x 357
The full code is:
import numpy as np
import matplotlib.pyplot as plt

# Create coordinate mesh for 2-D case
X, Y = np.meshgrid(np.linspace(-1, 1, 20), np.linspace(-0.5, 0.5, 20))

# calculate vector components
Vx = Y
Vy = -X

# create plot
fig = plt.figure(figsize = (12, 6))
plt.streamplot(X, Y, Vx, Vy, density = 1)

# show plot
plt.show()
Disadvantages of Streamplot
Despite it’s convenience, Streamplot have few disadvantages:
- It is pretty slow, so it is not always possible to use “on the fly”
- It is not using GPU acceleration of the computer
- Drown lines are discontinuous, which makes a bit senseless for serious analysis
But despite all these disadvantages it is very nice, and simple tool for studying vector fields.
Electric field with streamplot
I’ve already shown, how to plot electric field intensity with streamlines.
Published: 2022-09-21 18:00:56
Updated: 2022-09-21 18:04:29