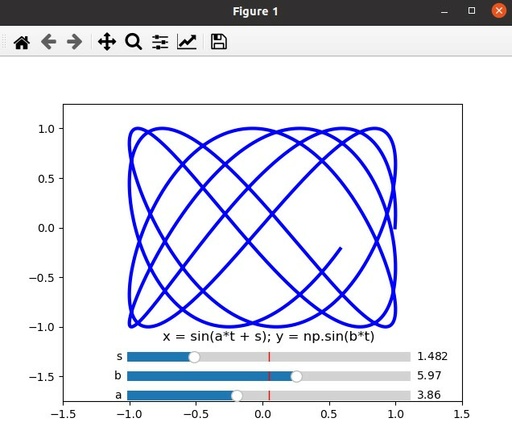
Interactive Lissajous curves with Matplotlib
On of the very interesting example of parametric curve is Lissajous curves.
Lissajous curves are given by set of parametric equations:
x = A*sin(a*t + s)
y = B*sin(b*t)
and for clarity, let’s consider A == B == 1.
In the previous article about parametric curves with SymPy I’ve make some introduction how to plot parametric curves. And it is possible to plot Lissajous curves with SymPy as well, for example in the code bellow, Lissajous curves for b = 4 and a in range from 1 to 9 are plotted.
from sympy import *
from sympy.plotting import plot_parametric

t = symbols('t')

s = pi/2
b = 4
for a in range(1, 10):
    title = f'a = {a}, b = {b}'
    x = sin(a*t + s)
    y = sin(b*t)
    plot_parametric(x, y, (t, 0, 2*pi), title=title)
But it is very difficult to use this plot for studying Lissajous curves, because it is very interesting to do some adjacent in coefficient and check results, comparing with experiment.
Therefore it is necessary to use interactive plot with opportunity to change parameters of the fly.
Interactive plotting
To make interactive plotting, it I very convenient to use Slider from matplotlib.widgets library.
To make interactive plotting, we need to create list of points in numpy array and use matplotlib to display them.
t = np.arange(0.0, 2*np.pi, 0.001)

s = np.pi
a = 5
b = 5

x = np.sin(a*t + s)
y = np.sin(b*t)
l, = plt.plot(x, y, lw=3, color='blue')

plt.axis([-1.5, 1.5, -1.75, 1.25])
At the beginning we plotting it for the start position and store resulting curve into 2DLine object. Also it is necessary to declare axis size- to keep plotting within fixed range.
At the next step we will initialize positions for sliders for each parameters (a, b, s) and Sliders itself
axa = plt.axes([0.25, 0.10, 0.55, 0.05])
axb = plt.axes([0.25, 0.15, 0.55, 0.05])
axs = plt.axes([0.25, 0.20, 0.55, 0.05])

sa = Slider(axa, 'a', 0, 10, valinit=a)
sb = Slider(axb, 'b', 0, 10, valinit=b)
ss = Slider(axs, 's', 0, 2*np.pi, valinit=s)
Also we need to declare behaviour of parameters with slider movement
def update(val):
    a = sa.val
    b = sb.val
    s = ss.val
    x = np.sin(a*t + s)
    y = np.sin(b*t)
    l.set_ydata(y)
    l.set_xdata(x)
If you want to send some parameters to function update, you need to do it though lambda call.
At the next step it is necessary to declare call up our update function on any changes of the slider
sa.on_changed(update)
sb.on_changed(update)
ss.on_changed(update)
And plot the curve at the end
plt.title(f'x = sin(a*t + s); y = np.sin(b*t)')

plt.show()
Scrreenshot id Interactive Lissajous curves plotted with Matplotlib
Original image: 636 x 550
Watch video about Interactive Lissajous curves to see all details.
Interactive Lissajous curves code
The full code for this Interactive Lissajous plot is here:
import numpy as np
import matplotlib.pyplot as plt
from matplotlib.widgets import Slider

t = np.arange(0.0, 2*np.pi, 0.001)

s = np.pi
a = 5
b = 5

x = np.sin(a*t + s)
y = np.sin(b*t)

l, = plt.plot(x, y, lw=3, color='blue')

plt.axis([-1.5, 1.5, -1.75, 1.25])

axa = plt.axes([0.25, 0.10, 0.55, 0.05])
axb = plt.axes([0.25, 0.15, 0.55, 0.05])
axs = plt.axes([0.25, 0.20, 0.55, 0.05])

sa = Slider(axa, 'a', 0, 10, valinit=a)
sb = Slider(axb, 'b', 0, 10, valinit=b)
ss = Slider(axs, 's', 0, 2*np.pi, valinit=s)


def update(val):
    a = sa.val
    b = sb.val
    s = ss.val
    x = np.sin(a*t + s)
    y = np.sin(b*t)
    l.set_ydata(y)
    l.set_xdata(x)


sa.on_changed(update)
sb.on_changed(update)
ss.on_changed(update)
plt.title(f'x = sin(a*t + s); y = np.sin(b*t)')

plt.show()
Published: 2022-09-11 04:05:45
Updated: 2022-09-19 01:17:31