Circle length calculation with the Monte-Carlo method
This is an indirect application of the Monte Carlo techniques because you can't calculate the length of the circle (or the surface area of a ball) but you can calculate related values, for example, the area of a thin line around a circle, or a thin layer around a sphere. Believing, that the layer is very thin, then its volume will be proportional to the length or surface area, depending on how many dimensions we are working.
This was the theory, but now we will do some practical calculations.
Calculation length of the circle
Code for Monte Carlo simulation
First of all, we need to load libraries, numpy for vectorized calculations and matplotlib. I will create code, which will work in any dimensional space.
import numpy as np
import matplotlib.pyplot as plt
Now we can define the following parameters: dim - the size of our dimension; N - number of trials; circle - radius of out circle; - half size of the box side; delta - thickness of the layer;
dim = 2
N = 1000
circle = 1.0
box = 1.5
delta = 0.2
Now, let's generate the random dataset and calculate the distances. We will calculate randomly located dots in the box sized 2*box, and our data set will contain N dots with dimension dim. For calculating distances from the centre we can apply the equation of the distance calculation along axis=1.
points = np.random.uniform(low = -box, high = box, size = (N, dim))
distances = (np.sum(points**2, axis=1))**0.5
When we have our test box filled with random dots, we need to classify these random dots, which one belongs to our studying surface, and which one belongs to the test square. For the studying surface, we will take dots the volumes from both sides, to compensate for the potential curvicity of the line (or surface). For the test square of the known volume (actually line with known length, we will take only dots from one side).
C_inside - mask for dots within delta from the circle; P_inside - mask for dots
C_inside = (distances >= circle - delta) & (distances <= circle + delta)
P_inside = (points[:, 0] <= delta) & (points[:, 0] >= 0.0)
Now these masks have only required dots and the relation of the volumes and respective circle lengths will be proportional to the sum of True values in these masks.
C = np.sum(C_inside)
P = np.sum(P_inside)
V = ((C/2)/P)*(box*2)**(dim-1)
The sum will only count True values. Volume - this is a very important equation, we need to take only half of the circle data because we've calculated from both sides and we need to take the average half and divide by plane dots. Then this ratio we need to multiply this by the test line or square size.
For circle length or two-dimensional case, we can check results by calculating π as follows: print(f"PI = {V/2}") and we will have some values in the vicinity of 3.14
Code for visualisation
Visualisation is a straightforward procedure, and I will not explain it in details, only will give you a code.
circle = plt.Circle((0,0), circle, ec='r', facecolor='none')
PP = points[P_inside]
CC = points[C_inside]
line_x = [0,0]
line_y = [-box, box]
fig, ax = plt.subplots()
ax.scatter(PP[:,0], PP[:,1], c='g')
ax.scatter(CC[:,0], CC[:,1], c='m')
ax.add_patch(circle)
plt.plot(line_x, line_y, linestyle='-')
plt.show()
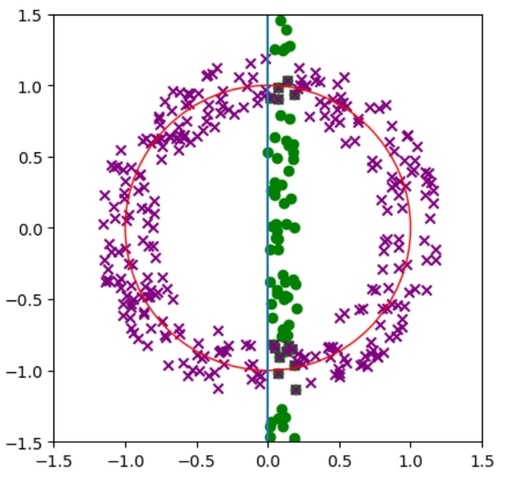
You will have something like that::

The distribution of the dots around circle (magenta) and around text line (green) dots. The test line was shown blue, and the circle was red. Comparing of number of red and green dots will give the ratio of double circle length and line length.
Original image: 698 x 655
It is important to mention, that for this technique, you only need to know, how to calculate the distance from the test point to the surface and choose the correct test surface. But this I will show in the following tutorials.
Also, it is very important to have a reasonable balance between the thickness of the layer and the number of random test dots.
Published: 2023-12-01 00:20:33
Updated: 2023-12-01 00:33:16